January 2, 2021
—
Sales
—
8 min read
5 Key Metrics to Include in Your Sales
Setting goals is the first step in turning the invisible into the visible.


Ben Bitvinskas
Co-founder, Atlasmic


Your sales strategy is a part of your business's success. Your mission is to keep it up to date and bring value to potential prospects. How can it be successful without setting clear metrics to follow? As business strategist Tony Robbins once said, "Setting goals is the first step in turning the invisible into the visible".
The same time, setting clear goals might be complicated as there are many different businesses out there. In this article, we'll share some of the most successful key metrics we've found that are used by our clients. They were happy to give us a head start.
Table of Contents
North Star Metric (NSM)
: Key metric for every businessCustomer Acquisition Cost (CAC)
: Expenses required for one new customerCustomer Lifetime Value (CLV)
: The average amount your business makes from a customerMonthly Recurring Revenue (MRR)
: Revenue your company makes each monthSales Cycle Length (SCL)
: How much time it takes for your visitor to become your customerNorth Star Metric (NSM)
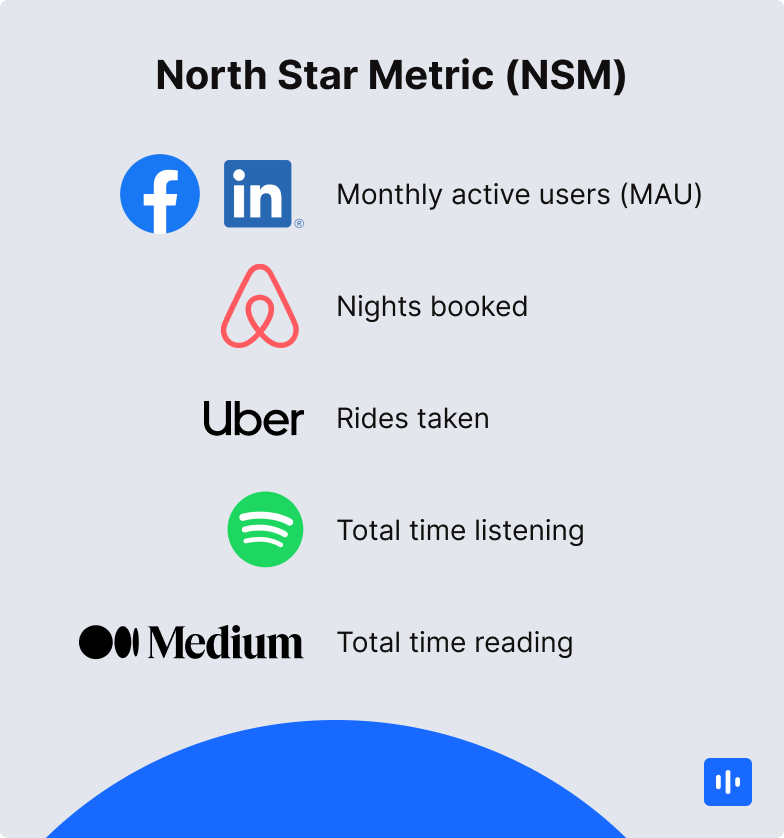
Every sales strategy consist of various metrics. From visitors count to conversions, there are many objectives in the business growth. But it's not just statistics you should be looking at. Almost every successful business has a "north star" measure. It is the key metric that reflects your business product strategy. Let's jump on some other companies examples.
Companies like Facebook or LinkedIn use a "north star" of monthly active users (MAU) as their primary metric. Marketplaces like Airbnb use nights booked as their metric, while Uber uses rides taken.
Content-based companies focus on total time activities, Spotify for a total time listening and Medium for a total time reading.

Almost every key metric we found involves way more than a mission. It also consists of an accomplishment which is delivered both internally and externally.
You can define your "north star" metric by answering these simple questions. Does the metric reflect company growth and give value to customers? Can you measure the progress of it? Once you get these answered - you're good to go.
Customer Acquisition Cost (CAC)
The title pretty much explains the measure definition. Think of how much money you need to spend in marketing and sales-related field to acquire one person to become your client. This metric is a reflection of how your business can adapt to the money to gather customers.
The formula for calculating CAC for all your business looks like this:

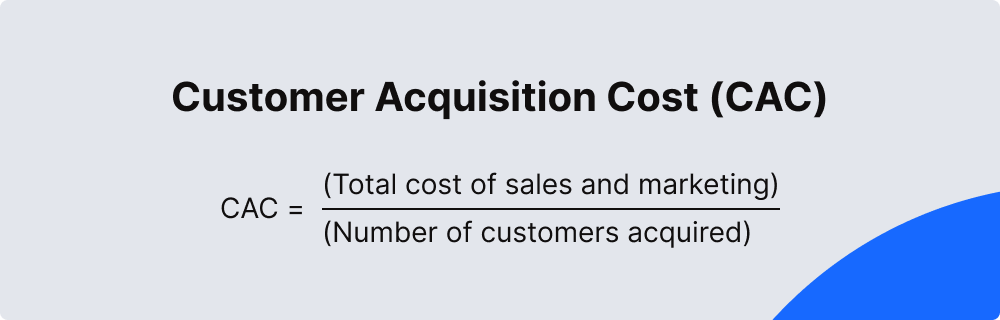
Imagine that you spent 1000€ in sales and marketing (Facebook, LinkedIn, etc.) to acquire 55 users. In this scenario, your CAC will be 18.18€ (1000€ / 55).
How to know if this is a "good number" for your business? If you look at the market trends, a good number should be at least 3 times lower than your CLV. Let's jump to what CLV means in sales analytics.
Customer Lifetime Value (CLV)
Customer Lifetime Value is probably the most popular measure you will find in every marketing book. Not only you need to track how many users your business has, how many sales you did in total, but also how much of the value comes from your loyal customer. And that's until he/she decides not to use your products or services anymore.
The formula of CLV can be expressed in various ways, but the most popular one is to calculate what is the average duration of your client base (how long is your business relationship with a single client), what is your revenue per user per that duration and what are the costs to acquire this one user, or CAC (as we used this one before in this article).
Without thinking of the inflation, the formula could look like this (and it is usually calculated yearly):
Customer Lifetime Value (CLV)
CLV = (Duration of your business relationship with a single client in years) * (Revenue per user per year) - (Customer Acquisition Cost, CAC)
Imagine that your clients usually stay with your business for 3 years and they spend 150€ yearly. This makes up a total value of 450€ per client per your business relationship with him/her. After subtracting customer acquisition cost, which in the previous example was 18.18€, your CLV would be 431.82€.
However, there might be some expenses to serve that client, like hosting costs for your website, operating costs, etc. This also could be added to the formula, by subtracting this value from the previous result.
Then the formula would be like this:
CLV = (Duration of your business relationship with a single client in years) * (Revenue per user per year) - (Customer Acquisition Cost, CAC) - (Customer Serve Cost per year)
As an example, if that's an extra 30€ per year to serve your client needs, the CLV value would be 431.82€ - (30€ * 3) = 241.82€
And that's a value you can come back pretty often. Whether your goal is to increase it or make it more stable - you should have it on your main measurement list.
Monthly Recurring Revenue (MRR)
If you are familiar with business communities like Indiehackers or Producthunt, you probably found a measure like MRR for once. This measure is crucial in your business evaluation and when looking at how your business is doing.
If you want to be aware of your sales, it is vital to know the revenue you bring to the business monthly. And this value is without subtracting or adding numbers. It consists of your monthly users and how much they spend on average per month.
Monthly Recurring Revenue (MRR)
MRR = (Amount of monthly customers) * (Revenue per user per month)
And that's simple. If you have 100 paying customers who pay your business 19€ per month, your MRR would be 1900€.
Eventually, MRR can be divided into some more in-depth views. There is a measure called "net new MRR". You can calculate it by including new and lost (churned) customers.
This can be written in a formula:
Net New MRR = (Amount of new monthly customers) * (Revenue per new user per month) - (Amount of lost monthly customers) * (Revenue per lost user per month)
And this module is explained in various ways. For example, if this month we have 10 new users who pay 19€ per month, but lost 3 big clients who paid you 50€ monthly, your Net New MRR could look like this:
Net New MRR = 10 * 19 - 3 * 50 = 40€
Eventually, this value is added to your MRR measure and, in total, you will have a view of how your business is doing. It is important to understand why there are increases or drops in the MRR value. By reflecting on how this value increases monthly or understanding the causes of falls, you can get a clearer view of growing your business.
Sales Cycle Length (SCL)
Firstly, it is a duration from the first touch of your potential client & your business and a transition to the paying customer. This measure in sales lets you calculate and predict how your business will look like in months. It is mostly used within businesses to have a certain prognosis on how many users there will be in the upcoming period. If you know that you have 1000 potential leads, with an average SCL of 43 days - you might expect them to buy your product at that time! Also, once planning your sales strategy, you might have a goal to lower the duration of the sales cycle length and make even faster conversions!
If you have only one conversion the SCL won't have a formula, it would be the total days between a lead had the first input with your business and the conversion.
If you have more than one conversions the formula look like this:
Sales Cycle Length (SCL)
SCL = (Total number of days between all the leads and conversions) / (Total number of conversions)
As an example, imagine you made 3 sales. The first one took 20 days to be made, the second one took 32 days, and the third took 60 days! In sum, you would get 112 days for all transactions to be completed. From this perspective, your sales cycle length SCL would be around 112 / 3 = 37 days!
How can you personally use this number for improving sales metrics? Most of the time, this measure can improve your sales pipeline. You can evaluate the probability of your customer's conversion and know when the sale will be made.
Conclusion
As you finish reading this article, you will have a piece of basic knowledge on what metrics you need to include in your sales process. Whether you are a small business or a large corporation, these measures will help you track your sales more efficiently and understand your business' ups and downs. While not only introducing these metrics to your business, it is also important to have a daily check-in on how they change. If you are looking for a spreadsheet - check this one, as we already prepared one for your business.
If you are looking for a more efficient way to increase your sales and find these metrics in action - try Atlasmic.
More for your business growth

August 30, 2023
—
Marketing
—
3 min read
Power of Humor in Conversational Marketing
Learn how a witty opening line can convert anonymous visitors into potential clients.

Vaida Bit
Marketing, Atlasmic

May 10, 2022
—
Marketing
—
5 min read
COB vs EOD: Key Differences and When to Use Them
Learn about two abbreviations that are often used in business.
Ben Bitvinskas
Co-founder, Atlasmic
Sales Acceleration Platform. Copyright © 2023 Atlasmic.com